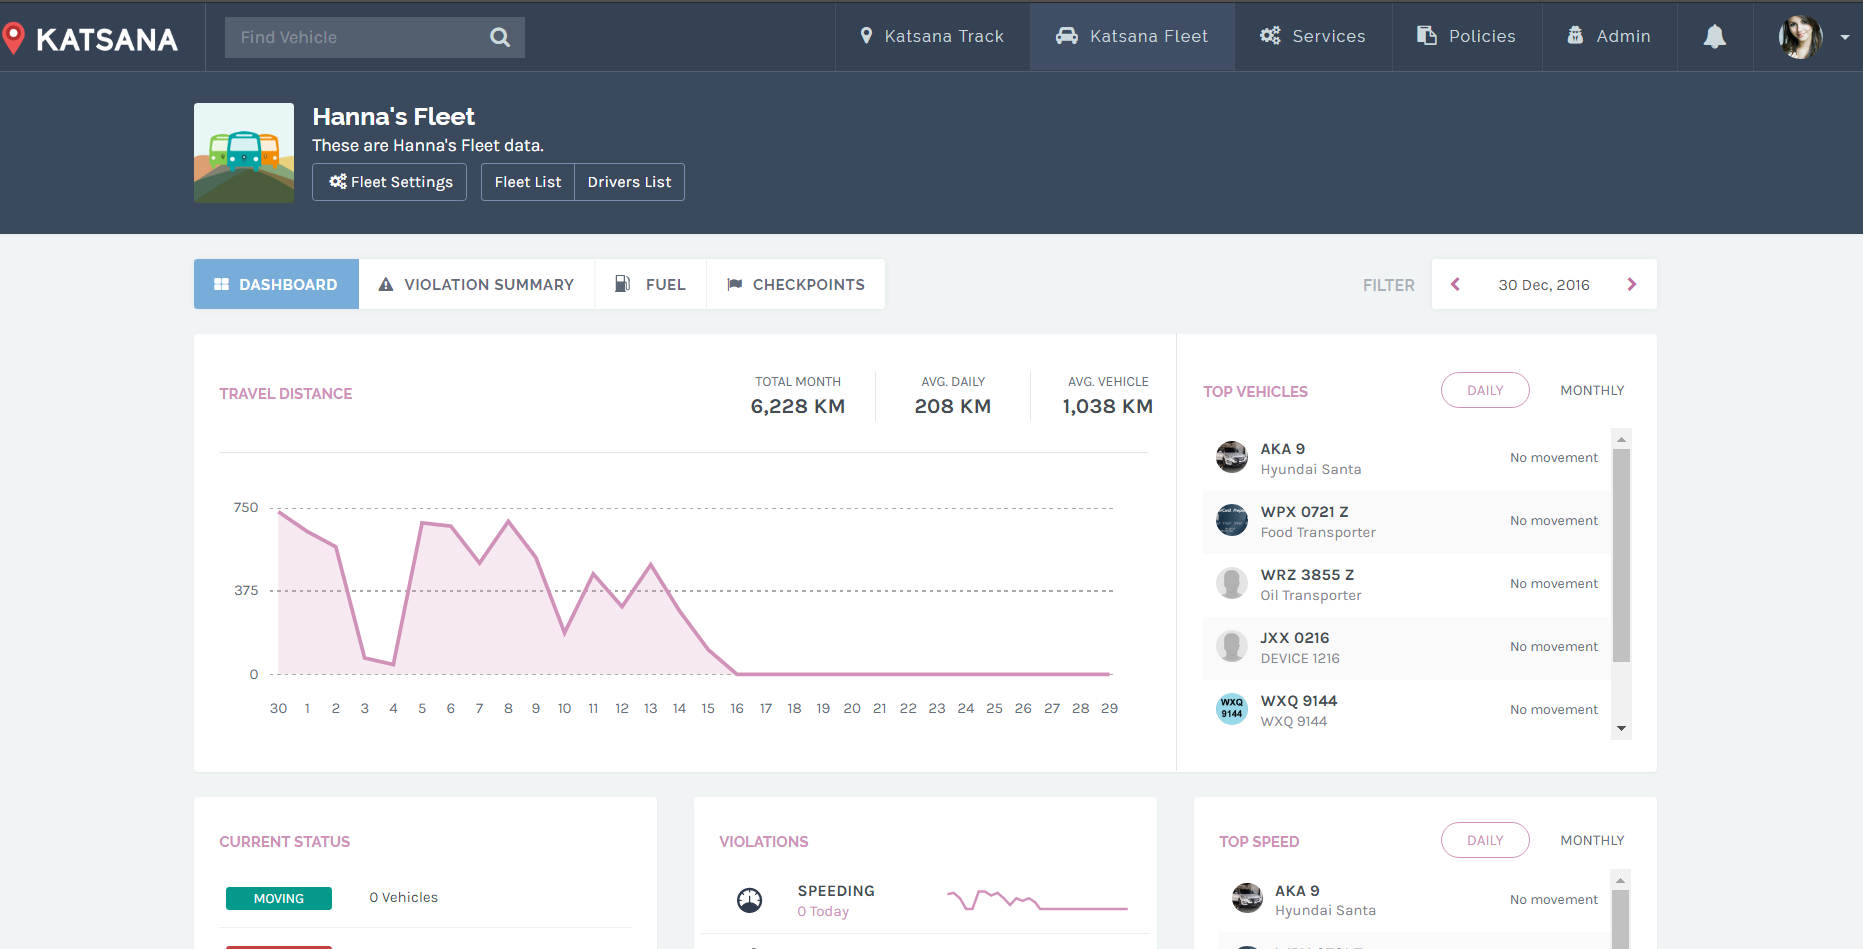
Fleet dashboard contains all of the crucial information pertaining to your fleet. Each information will be presented in a segment of it’s own (or it’s own card). Here are the available cards and it’s information:
1. Filter
2. Travel Distance and Top Vehicles
4. Violations
5. Top Speed
Filter
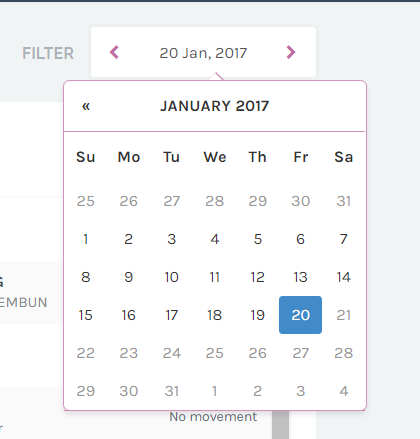
You can filter all the data information in the fleet via date by clicking on the date in “Filter”. Choose your desired date from the calendar and Katsana will load the data for the chosen date.
2. Travel Distance and Top Vehicles

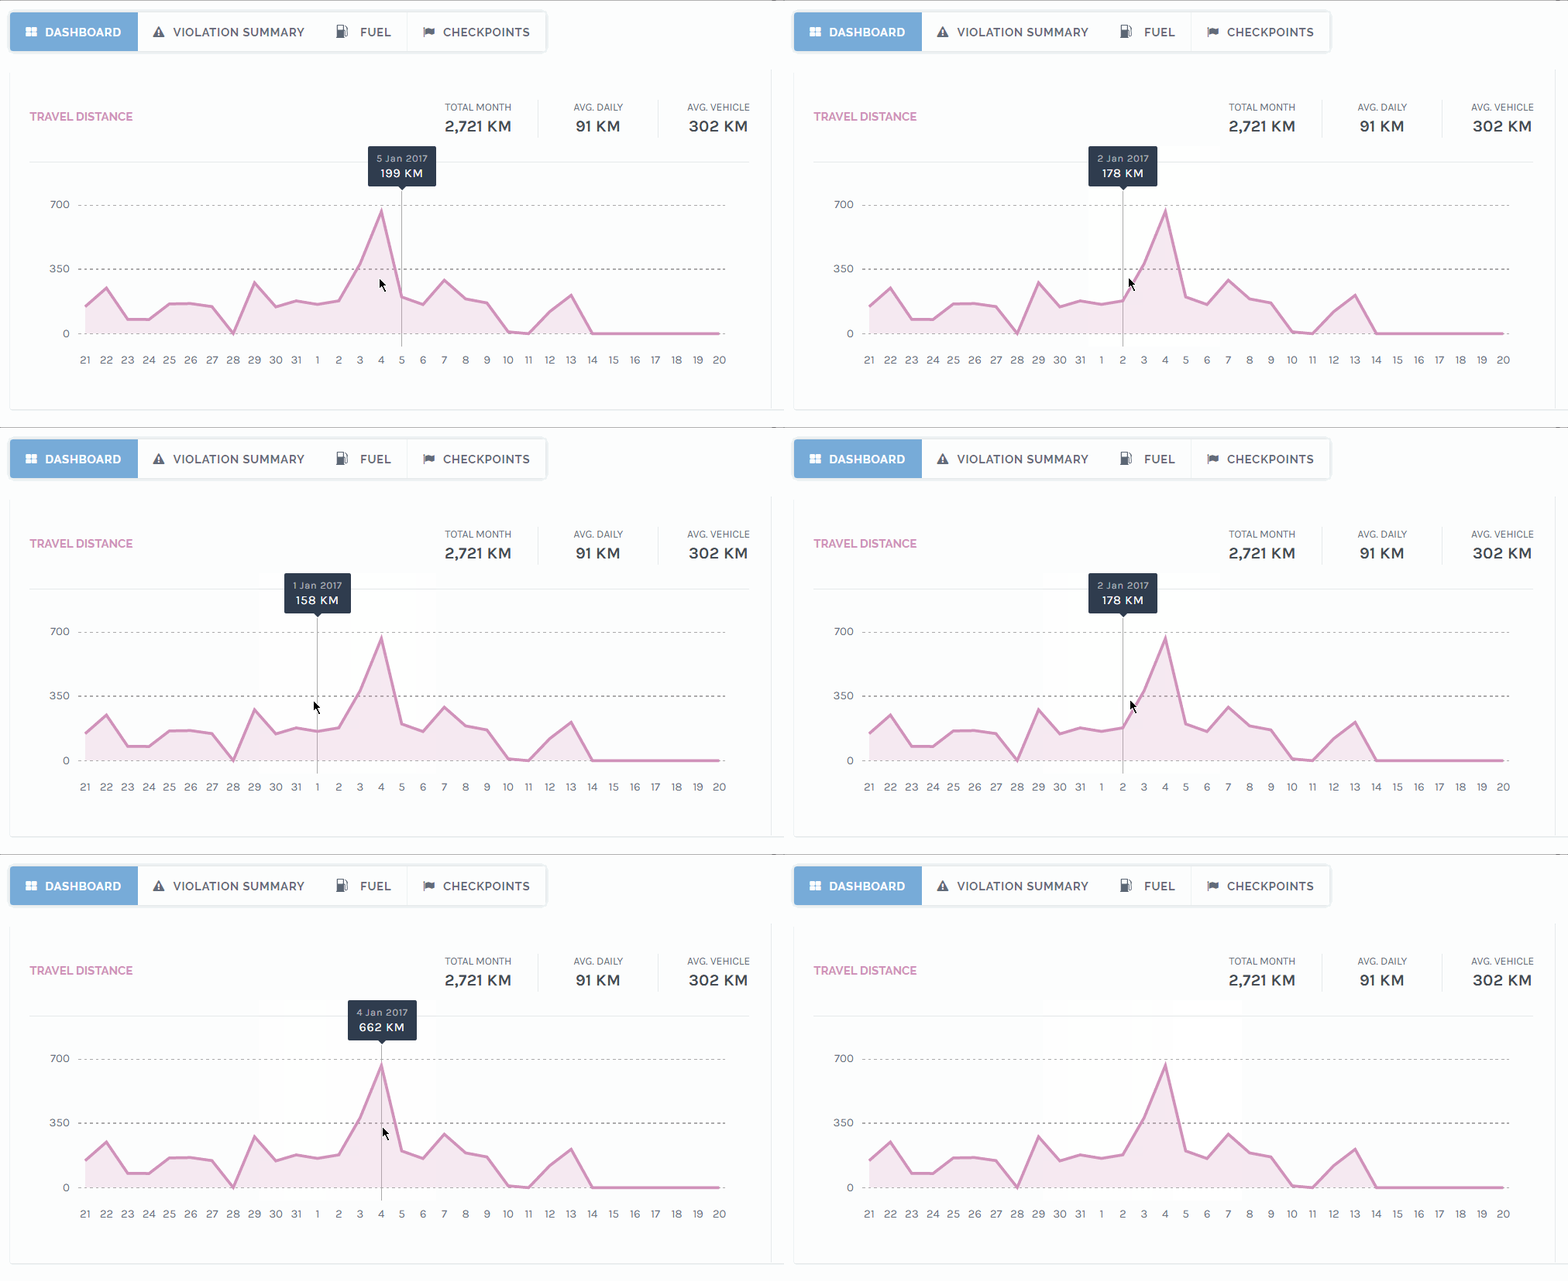
Travel Distance shows the total traveled distance for all of your fleet. For the graph, the x-axis represents dates, while the y-axis represents distance. You can get more information by hovering your mouse’s pointer on the graph.
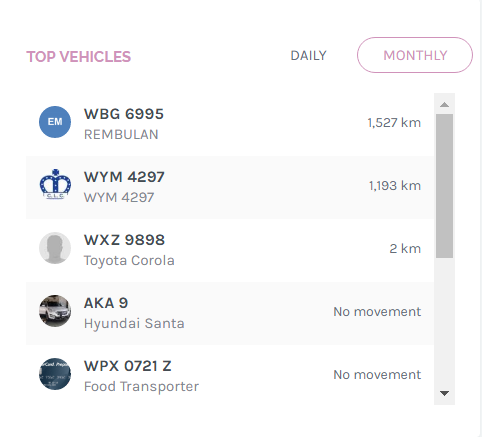
Top Vehicle shows your vehicles in order of the furthest distance traveled. You can view this either by daily (click on the ‘DAILY’ button) or monthly (click on the ‘MONTHLY’ button).
4. Current Status
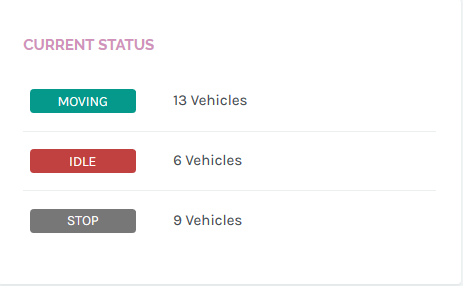
Current status shows your vehicle’s status –
| Moving | : | Vehicles that are currently moving on the map. |
| Idle | : | Vehicles that are currently not moving but has it’s engine still turned on. |
| Stop | : | Vehicles that has already stopped and has it’s engine turned off. |
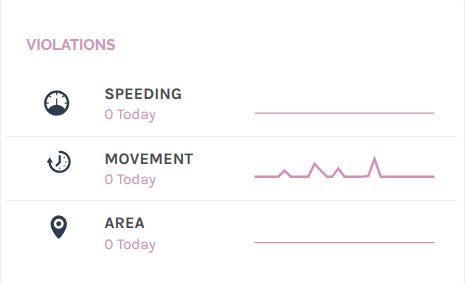
5. Violations
6. Top Speed
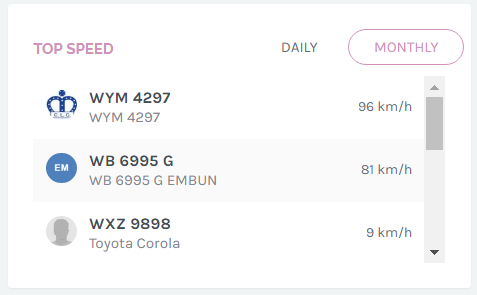
Top Speed shows your vehicles in speed in descending order. You can view this either by daily (click on the ‘DAILY’ button) or monthly (click on the ‘MONTHLY’ button).
7. Idle Duration
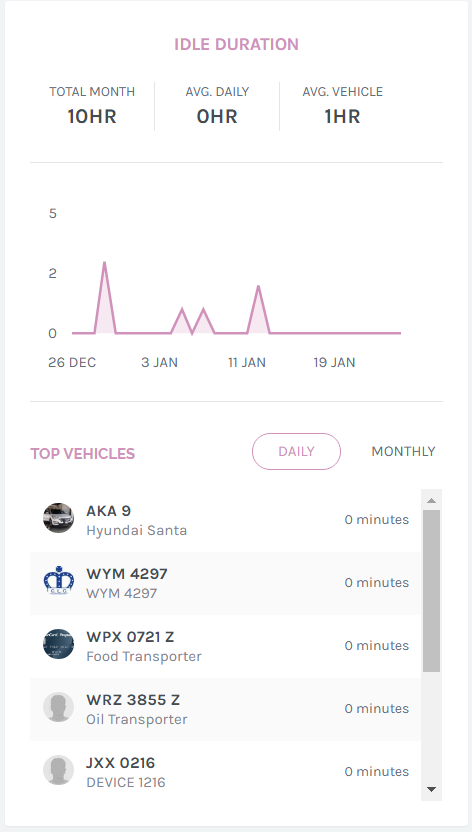
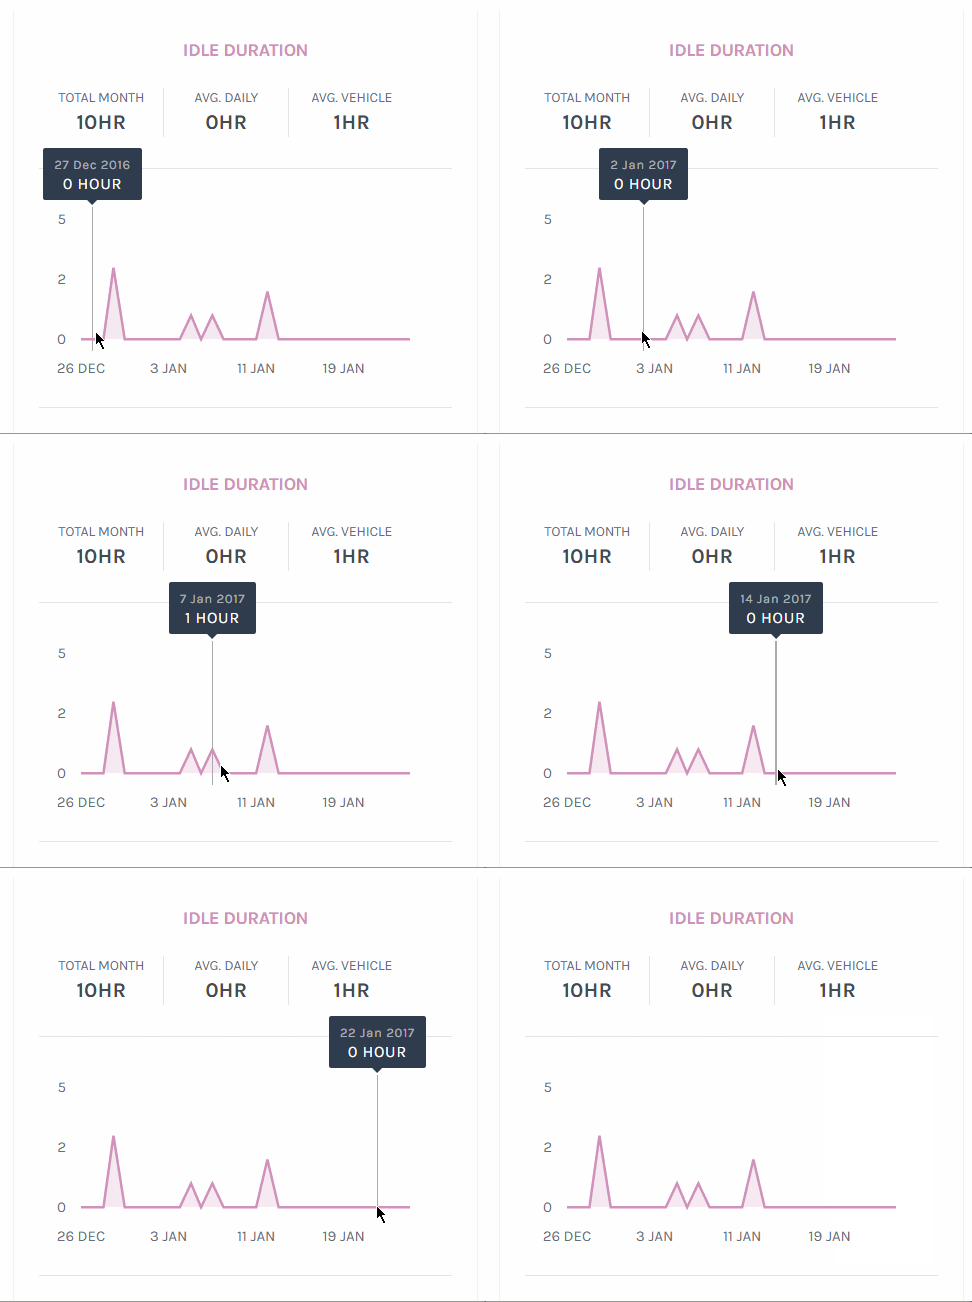
Idle Duration shows your vehicles’ total idling in descending order. You can view this either by daily (click on the ‘DAILY’ button) or monthly (click on the ‘MONTHLY’ button). More information can be obtained by hovering your mouse’s pointers on the graph:
8. Violations Overview
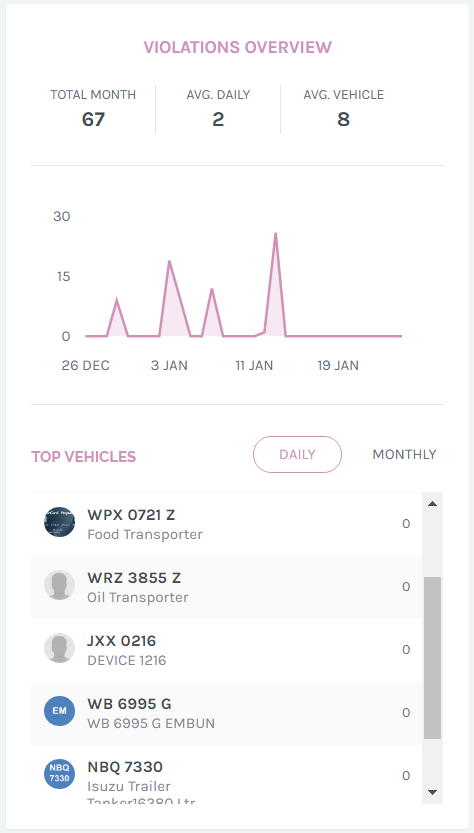
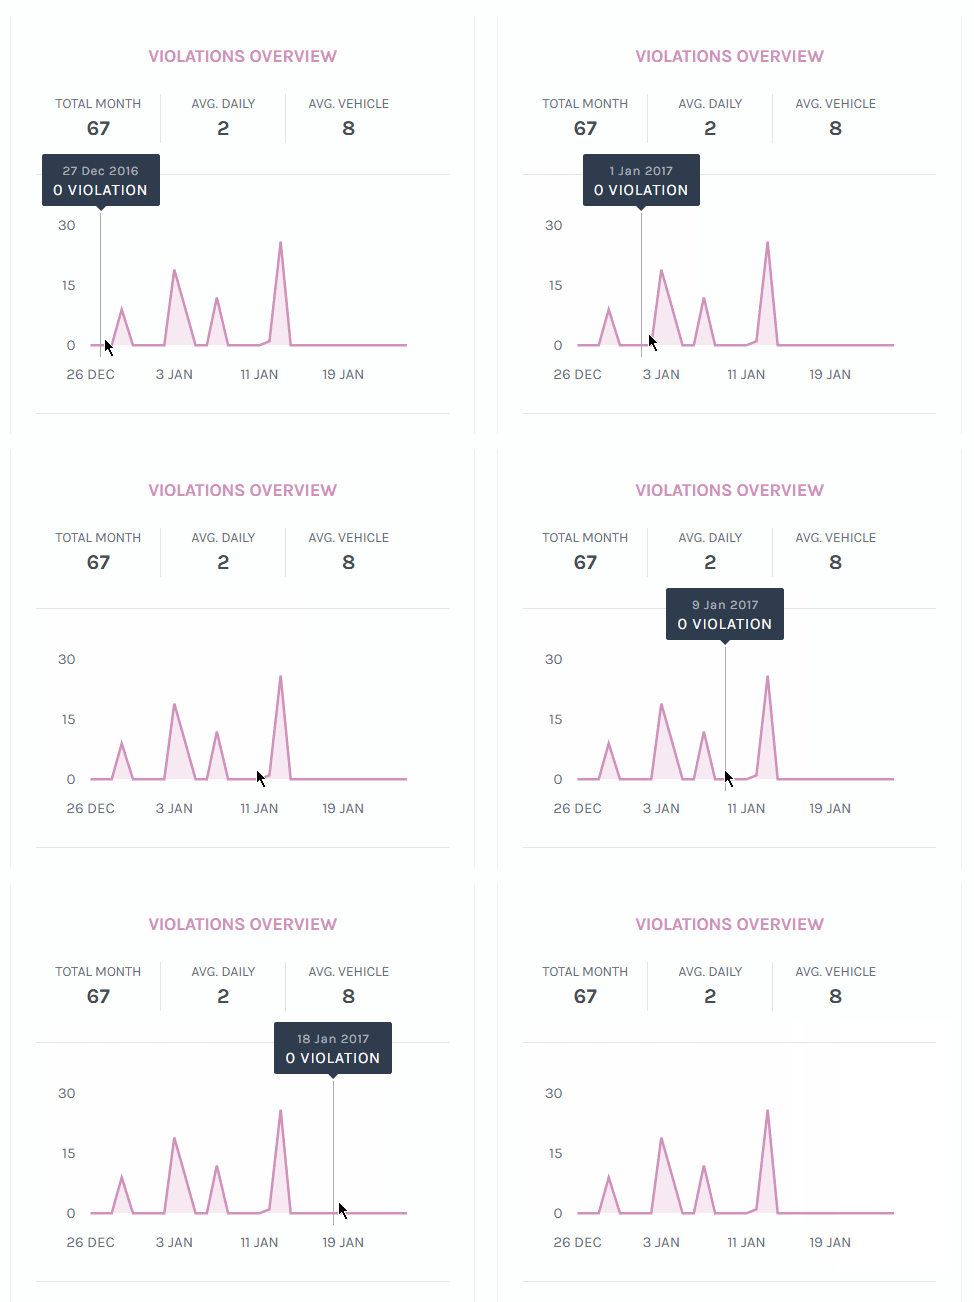
Violation Overview shows your vehicles’ total policy violation in descending order. You can view this either by daily (click on the ‘DAILY’ button) or monthly (click on the ‘MONTHLY’ button). More information can be obtained by hovering your mouse’s pointers on the graph:
9. Active Durations
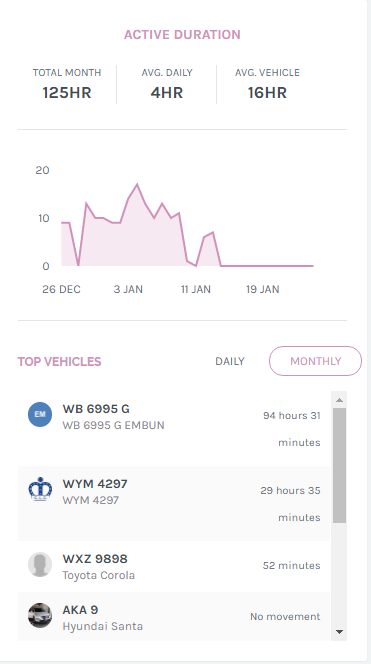
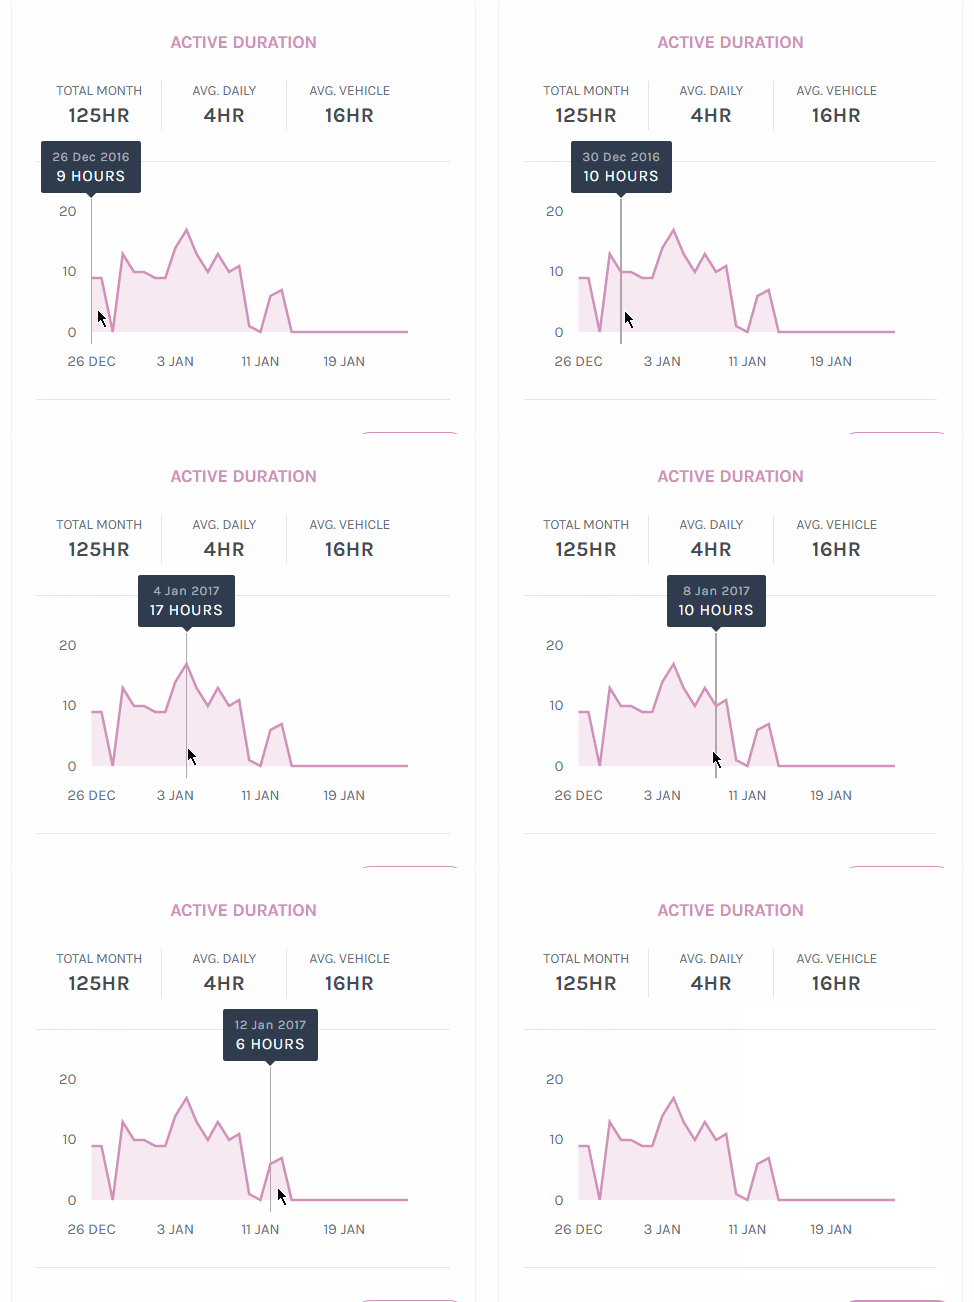
Active Duration shows your vehicles’ total activity time in descending order. You can view this either by daily (click on the ‘DAILY’ button) or monthly (click on the ‘MONTHLY’ button). More information can be obtained by hovering your mouse’s pointers on the graph:
