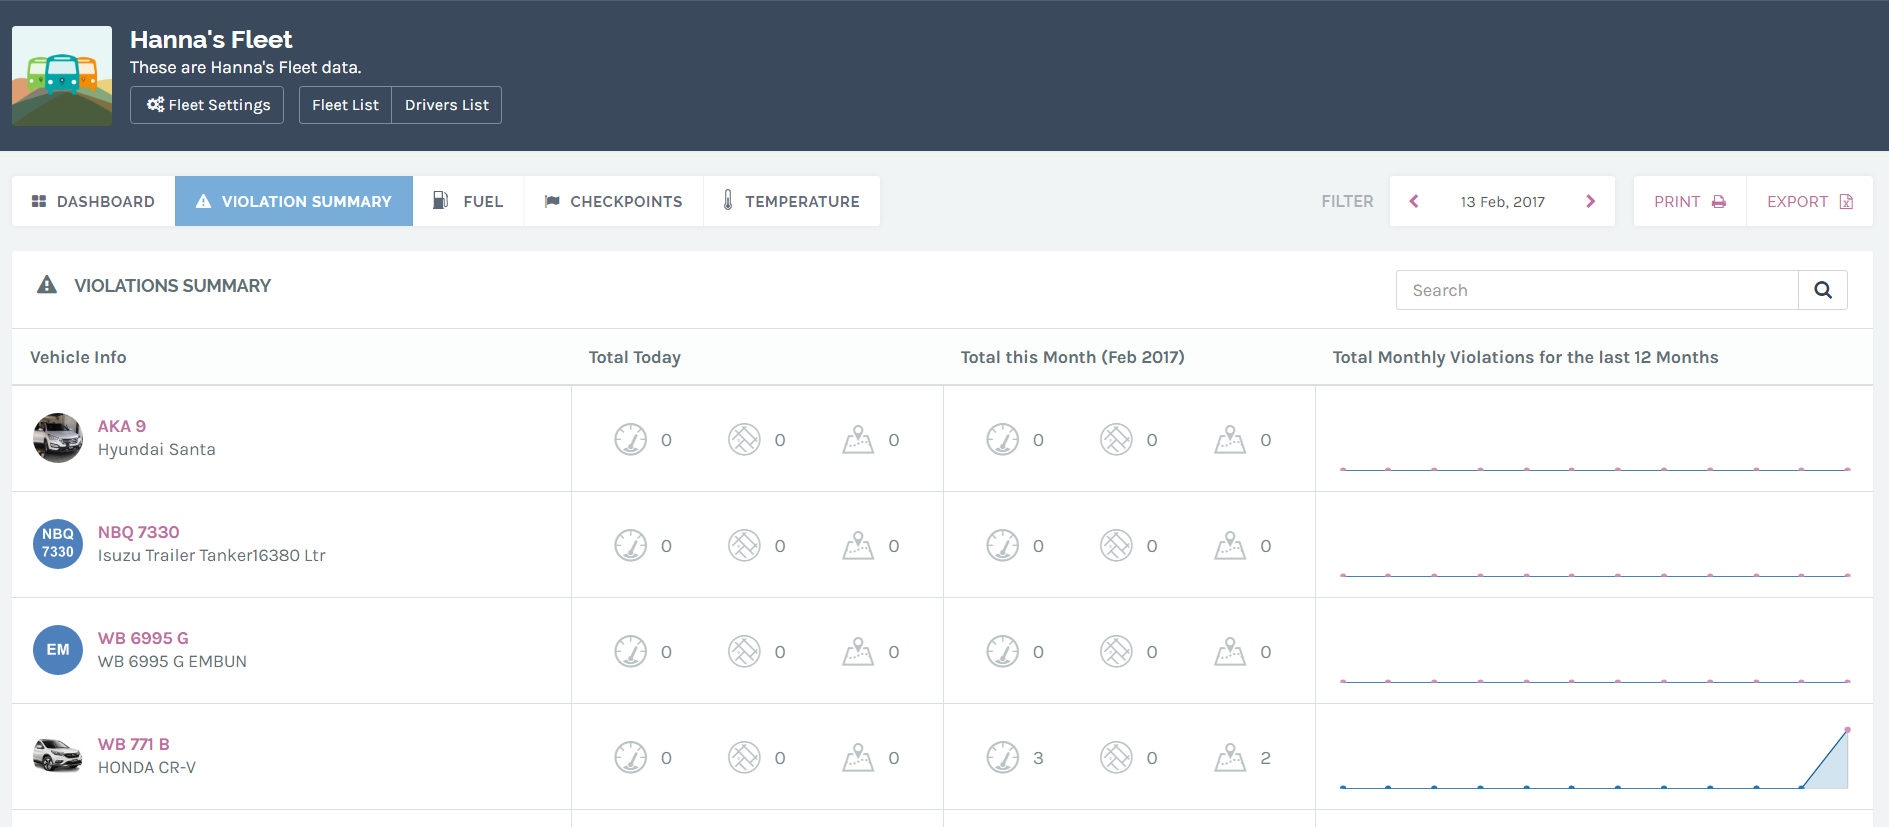
In this page, users are able to view, in overview, the total violations for each of the fleet vehicles. Here are the things that you can do on this page:
Meaning of each icons and tables.
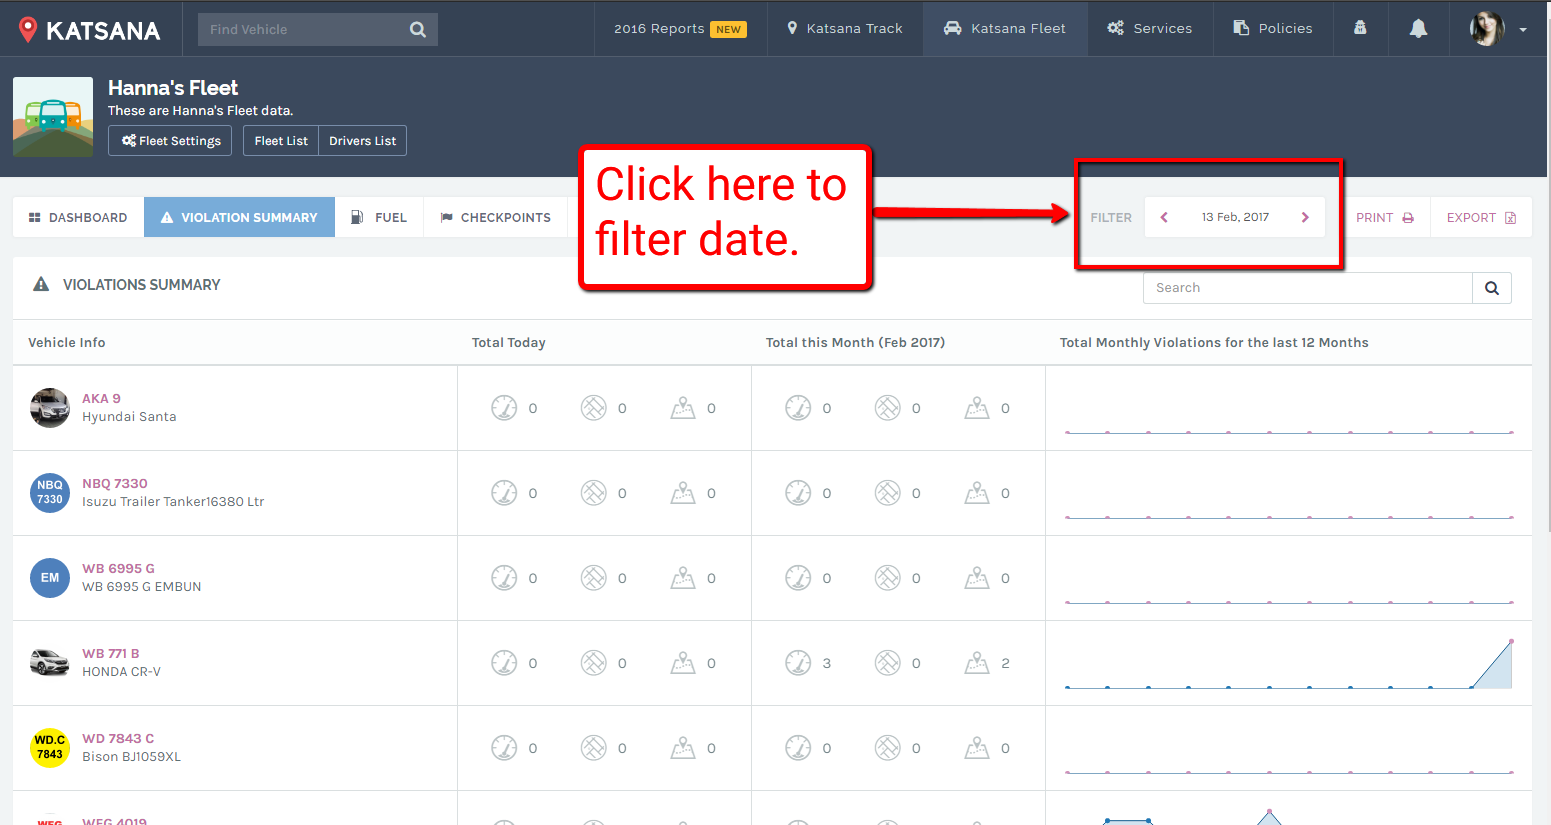
Filter the report according to date.
Meaning of each icons and tables.
| Vehicle Info | : | These are your fleet’s vehicle list, sorted in according to plate numbers. |
| Total Today | : | The total violations the vehicle committed for the particular chosen day. |
| Total this Month | : | The total violations the vehicle committed for the particular chosen month. |
| Total Monthly violations for the last 12 Months | : | The total violations the vehicle committed for the previous 12 months from the chosen date. |
Here are the meaning of each icons:
| : | This represents the “Speeding” policy. | |
| : | This represents the “Area” policy. | |
| : | This represents the “Movement” policy. |
The numbers at the side of each icon represents the total number of breaches for the respected column. A “3” besides “Speeding” icon under “Total Today” means that there are 3 speeding policy breached by the vehicle on the chosen date.
Filter report according to date.
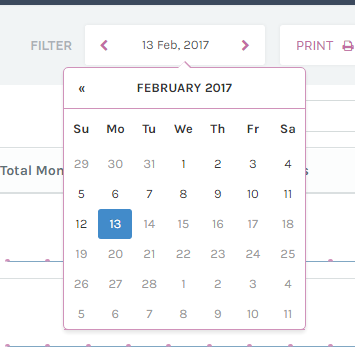
You can filter the report by simply clicking on the date filter shown above. Refer to the screenshot:

A calendar will pops up, allowing you to choose your date.

Once chosen, the report will be filtered in according to the date.
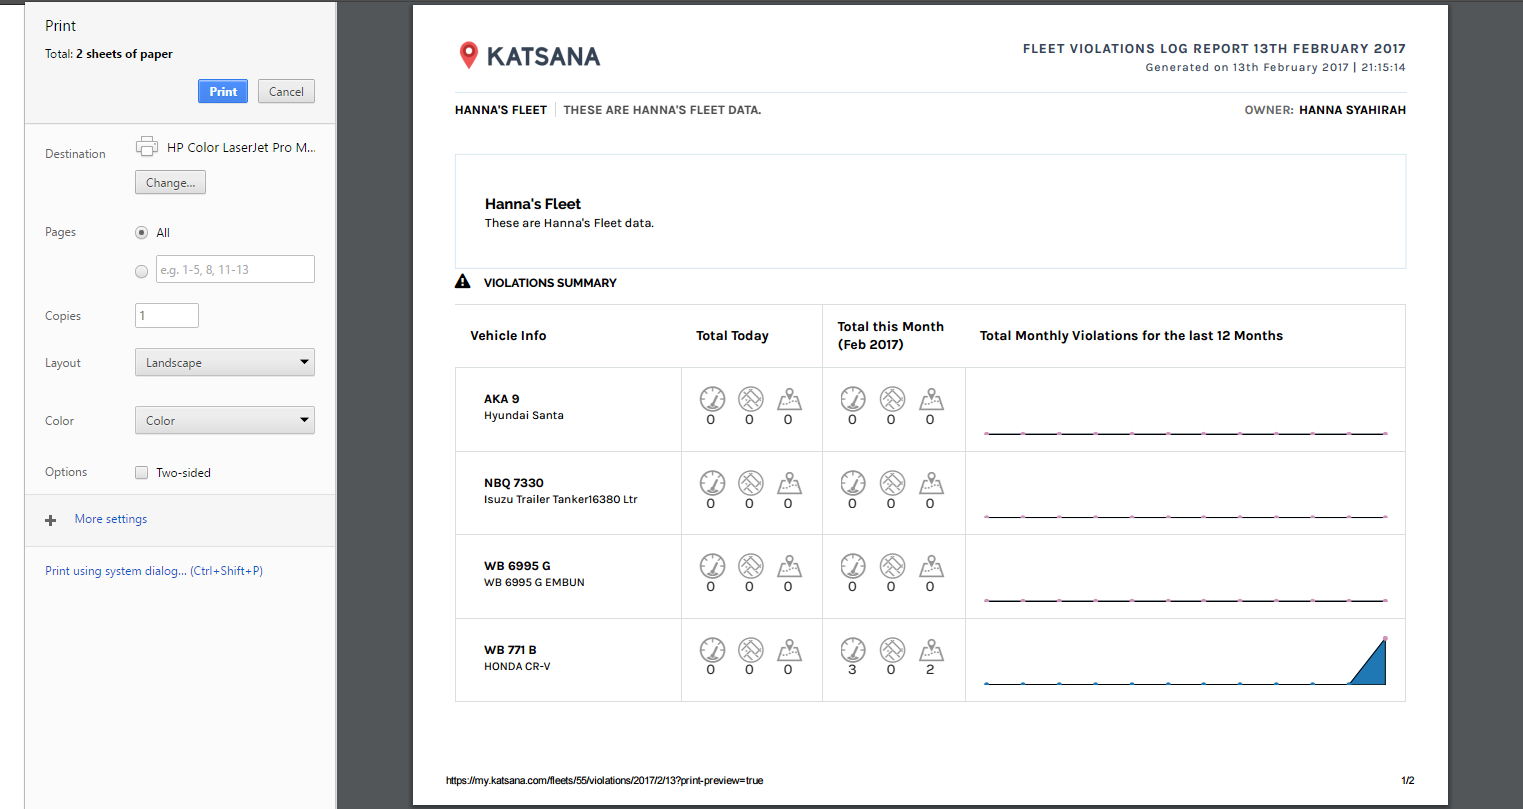
Print the reports
Simply tap on the ![]() button located at the top-right section of the page. A new tab will be opened automatically and prompts you to choose your printer.
button located at the top-right section of the page. A new tab will be opened automatically and prompts you to choose your printer.

You can print the reports to .pdf in order to distribute it in soft copy.
Export the reports
You can also exports the data into a raw, .csv file. Click on the ![]() button and your browser will prompt you to save a .csv file. Choose a location to save and open it once the download is finished.
button and your browser will prompt you to save a .csv file. Choose a location to save and open it once the download is finished.
You can use Microsoft Excel or OpenOffice’s Calc to view the file. For best viewing and data manipulating, we suggest Microsoft Excel.
There will be 8 columns in the .csv file. Here are the explanation of each columns:
| vehicle_number | : | This is the vehicle number of your fleet. |
| description | : | This is the description of the vehicle. |
| speeding_today | : | The total speeding policy breached for the chosen date. |
| area_today | : | The total area policy breached for the chosen date. |
| movement_today | : | The total movement policy breached for the chosen date. |
| speeding_month | : | The total speeding policy breached for the chosen date’s month. |
| area_month | : | The total area policy breached for the chosen date’s month. |
| movement_month | : | The total mvoement policy breached for the chosen date’s month. |